I was alerted to the fraud by Tom Stevenson, a very sharp knife who usually writes for the London Review of Books. For him, the dramatic reduction in extreme poverty hailed by the World Bank—and taken seriously by many serious people, including myself until he alerted me—just did not pass the laugh test. Specifically, researchers associated with the Bank and cognate institutions responsible for poverty alleviation have estimated that the rate of extreme poverty has declined from 25% of the world population in 2000 to around 8% by 2018.
The percentage of population earning less than a dollar a day has allegedly fallen dramatically since the neoliberal counterrevolution of the late-1970s.
Another index, based of the percentage of the global population that can afford to pay for basic needs like food, clothing and shelter, allegedly shows the same collapse.
This simply does not compute. The global extreme poverty rate cannot be below 10%, simply because there are more people in extreme poverty in South Asia alone. According to statistics compiled by the Government of India, more than 30% of Indian kids are stunted, meaning that they are so malnutritioned that they’re significantly shorter than they should be (per height-for-age reference charts). Now, 30% of the Indian population is already 5.3% of the world population. They don’t have enough to eat, but they’re out of extreme poverty?
So, the World Bank’s and OECD’s numbers don’t pass the laugh test. But the laugh test is a sanity check, not a formal proof that the poverty statistics are wrong. In what follows, we’ll marshal considerably more compelling evidence that the World Bank’s numbers don’t add up. We will document a systematic bias in the extreme poverty statistics for lower middle income countries over the past few decades. This group of nations accounts for 3.3 billion people, or 42% of the world’s population—and the vast bulk of the alleged reduction in extreme poverty.
The idea for the test is very simple and intuitive: variation in poverty rates, if they are indeed kosher, should track variation in, say, life expectancy—or any other measure of general well-being of a populace. If they don’t, and do so in a persistently biased way, then something is wrong with their production process.
We proceed as follows. We obtain data on extreme poverty rates from Clio-Infra compiled by Michail Moatsos and also published by the OECD. There are two metrics: (1) percent of country’s populace making less than a dollar a day; and (2) percent of the populace unable to afford basic necessities. The time period covered is 1820-2018. We shall restrict attention to the past century, when the data is much more reliable. We obtain life expectancy data from Our World in Data, which is ultimately based on UN estimates.
We detrend the data by computing 5-year changes in life expectancy and the two poverty rates. We rotate the variables so that positive numbers are good (ie, we read a decline in poverty rates as positive and a rise as negative). This makes the results easier to interpret. Having detrended and rotated the variables, we carry out two panel regressions. In both, we stratify by World Bank income group.
The response or dependent variable in both will be one of the two extreme poverty rates; the feature or predictor will be life expectancy. We admit both time fixed-effects and income group fixed-effects. The former is especially important because we need to rig the game against our result that the recent numbers are particularly biased. We cluster errors by income group. We have 1,797 country-period observations—more than enough for our purposes. Here’s what the data looks like:
Here’re the results of the first regression. We find the expected gradient (b = 0.1933, p < 0.0001).
Here’s the second regression. Again, we find the expected gradient, although it is only marginally significant (b = 0.1070, p = 0.0923). If we drop the time fixed-effects, the gradient becomes very significant (b = 0.1562, p = 0.0012). But, as mentioned before, we will retain the time fixed-effect because it hurts our case—if we still recover a systematic bias, then that result would be even more compelling. Although please note that the main result here is robust to alternate specifications.
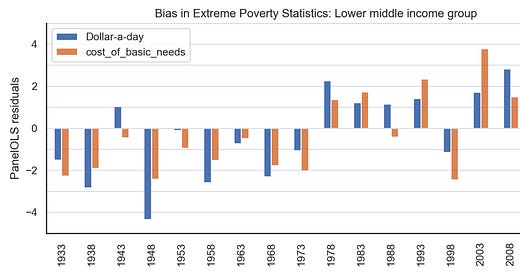
Here’s the main result. We look at the mean residuals by income group and time. This is contains information on the systematic bias of the poverty statistics—if any exists. If there were no systematic bias, then the residuals would be more or less random. In particular, we should not see persistent decades-long runs of over-prediction and under-prediction by our simple model.
This is not what we find. Instead, we find that, for the critical lower middle income group, gains in life expectancy overpredict reductions in extreme poverty until 1975, when the precipitous decline in global rates is alleged to have begun in earnest (see the first two graphs in this note). Conversely, from 1975 on, and especially after the Millennium Development Goals were announced in 2000 to great fanfare, we find that gains in life expectancy systematically underpredict the alleged dramatic reductions in poverty rates. In other words, the dollar-a-day and cost-of-basic-needs poverty rates paint too rosy a picture of reductions in global poverty.
The Low income group only contains 680 million people. These LDCs are conflict-prone countries with considerable instability and dysfunction. They show a very different pattern. It is not clear how to interpret this pattern, although our guess is that this may be due to region-specific factors in Sub-Saharan Africa.
The high income group has a population of 1.2 billion people. This group also shows a recent systematic bias; but in the opposite direction. This is because extreme poverty rates are extremely low in these countries, so there isn’t much room for improvement. Meanwhile, gains in life expectancy have continued long after extreme poverty was practically eradicated from the Global North. So, the recent negative bias here is understandable, and does not contain a signal of something having gone wrong with the production of poverty rates.
The high income and low income groups are either quite irrelevant or too small to move the needle on global poverty. The action is all in the lower and higher middle income groups. For the latter, we do not find a systematic bias. The large negative residual in 1993 is probably due to the communist collapse, since most of the former communist states are in this group. Gains in life expectancy do underpredict poverty reduction in this group during the 1970s, but that does not persist. The pattern since the mid-1990s is basically random. So, there’s no compelling systematic bias here.
In sum, we have shown that the World Bank’s extreme poverty statistics have been implausibly rosy for the crucial group of lower middle income countries—the principal site of the alleged dramatic reduction in global poverty—precisely in the period of the alleged dramatic reduction in extreme poverty. As a final sanity check, and to communicate the full import of the result, we look at the most important case.
India is the most populous country on earth. It is where the war on global poverty will be decided—not through fraud, but through hard work and good policy. Here again, we find the same striking pattern that we found for the lower income group as a whole. Gains in life expectancy overpredict reductions in extreme poverty until 1968. The series then become stationary and random until the Millenium goals are announced. And then we see a persistent, systematic bias whereby the alleged gains in extreme poverty reductions are simply not matched by gains in life expectancy.
I understand that the World Bank and other global development institutions are large ensembles of offices. In such bureaucracies, things can go wrong because those who know, don’t have the authority; and those who have the authority, don’t know.
But, look guys, the chasm that has now opened up between the self-congratulatory discourse of the global development institutions and ground realities has become ridiculously large. There are thousands of researchers who can replicate the result presented here. This is not something you can hide under the carpet, even if it made sense for interested parties to tolerate all of us becoming progressively less informed about the large-scale realities of our unforgiving world. Fix it.
There is also a measurement problem with industrialization: extremely poor farmers with no income made all their own stuff. With industrialization, they left the farms, moved to the cities, got paid a little more, and had to buy their stuff instead of making it. They made more money, the GDP went up, but in reality they were worse off.
this econometric exercise does not identify a bias in poverty statistics. the residuals from a panel regression of life expectancy on poverty rates can reveal which places have worse changes in health outcomes than would be expected based on changes in their poverty levels. but there is no reason to think that the relationship between poverty rates and health is stable or strong enough to merit interpreting this as a bias.
consider the literature on health and recessions. many studies find mixed evidence of recessions on health outcomes. people are definitely poorer during recessions. it would be a mistake to infer that we are mis-measuring recessions because health outcomes don't decline enough.
it is entirely possible for extreme poverty to decline while levels of malnutrition remain elevated (though note that according to the link you cite, rates of stunting are declining over time in india). extreme poverty is an ad hoc definition of poverty (1$ a day in 1996 prices) but more moderate forms of poverty are also strongly associated with child malnutrition that leads to stunting. it is difficult to feed a child to reach full height at 2$ a day or 5$ a day, but going from 1$ a day to 2$ a day is still a decline in poverty.