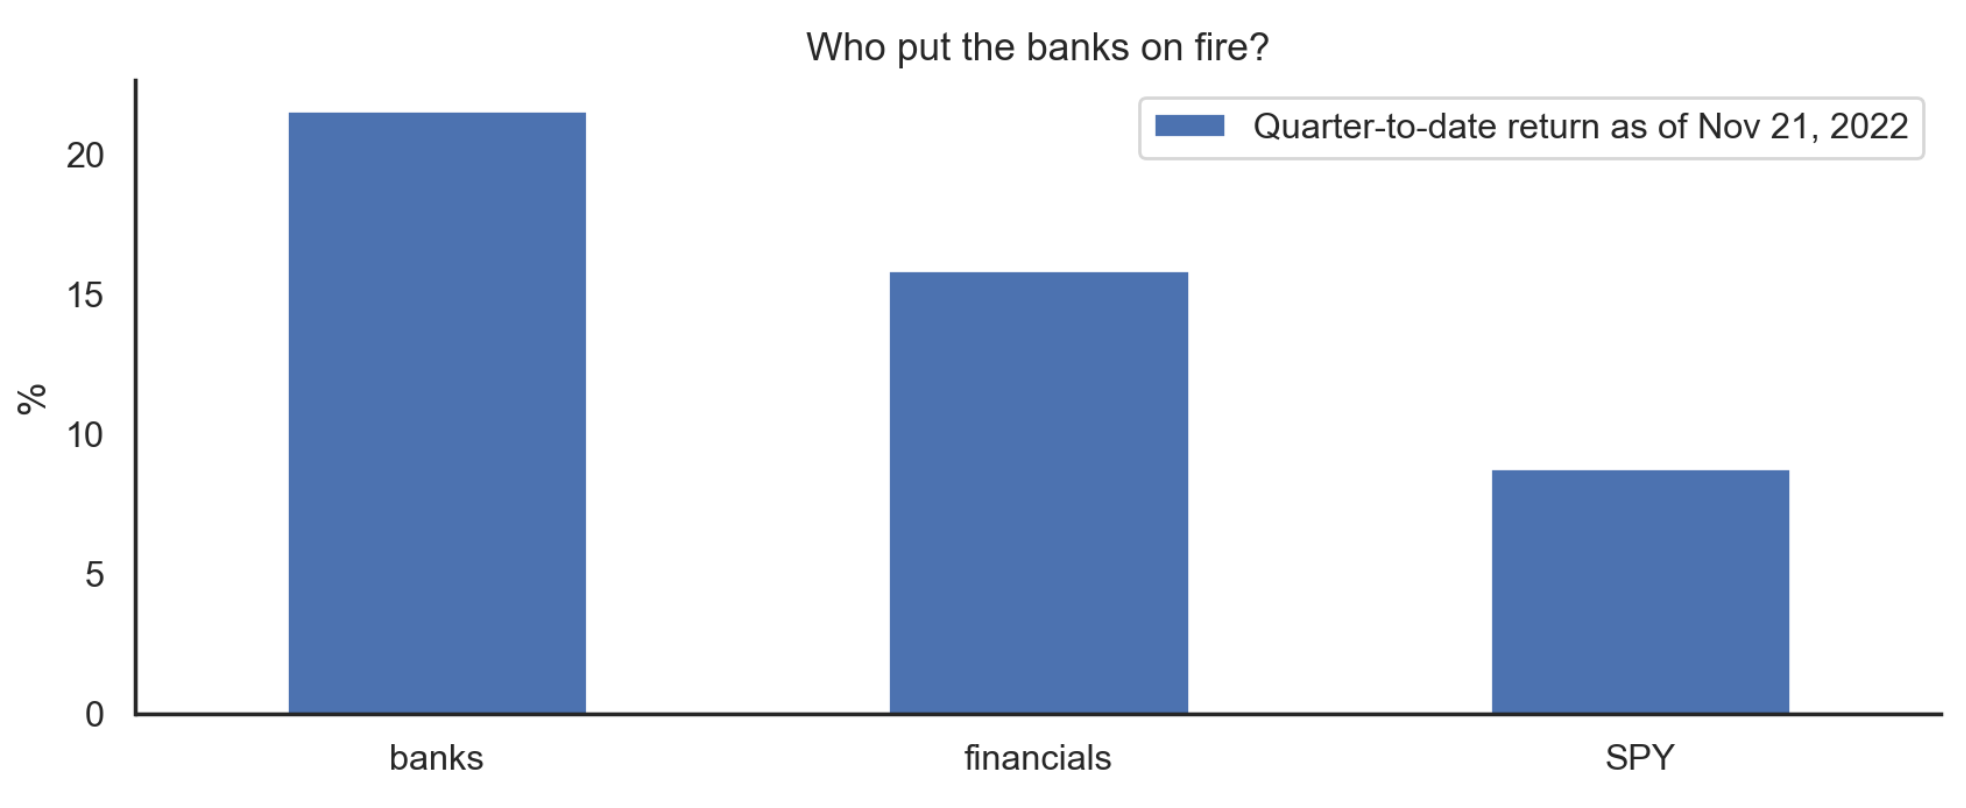
Something very strange is happening in the market for the world’s premier risk asset. While the SPY is up 8.8% quarter-to-date as of the closing auction on Monday, financials are up 15.8% and banks are up 21.6%. This is very, very strange.
To see just how strange this is, here’s the returns of the GICS sectors for reference. As I explained in the penultimate dispatch, the relative momentum of cyclical and defensive stocks contains a very strong signal of market-wide risk appetite. In terms of the relative performance of these sectors, the market is pricing an imminent recession: cyclicals are down 1.0% so far this quarter, while defensive stocks are up 11.2%. Yet, banks are on tear, performing second only to energy stocks. Bank stocks should be getting killed given that the damn economy is falling into a recession! Aren’t they supposed to be leveraged bets on the economy? Very strange.
Note that Banks are not a GICS sector. We construct a market-weighted portfolio of the biggest dealer banks: JP Morgan, BofA, Wells Fargo, Citi, Goldman Sachs, Morgan Stanley, and BNY Mellon. This is a pretty concentrated portfolio with a third of the weight on JP Morgan and a quarter on BofA. We’re interested in this portfolio not because it is an attractive portfolio to hold (it’s not), but because it contains macroeconomic information of great significance. For one of the main takeaways of the intellectual revolution in macrofinance is that these systemically-important financial intermediaries are crucial to the transmission of monetary policy.
Adrian and Shin argued in a famous paper that yield curve inversions predict recessions because compressed spreads lower net interest margins, reducing forward-looking measures of bank net worth, thus lowering their appetite for credit creation and risk-taking. Tight money means poorer funding conditions for banks, which must then reduce their exposures to meet their risk constraints. With a lag of about three quarters to a year, this tempers future investment and real activity. A crucial assumption of this model is that banks are in the business of maturity transformation — that they borrow at the short end and lend at the long end of the yield curve. This is what makes the slope of the yield curve so central to monetary policy transmission.
Now, the yield curve is most definitely inverted. As of yesterday’s market close, the yield on the 10-year note is 3.82%, while that on the 3-month bill is 4.38%. Yet, bank stocks are on fire. Why?
In order to investigate this puzzle, we estimate the impact of yield curve shocks on bank stock returns. We always control for market returns since we’re interested in isolating the impact of rate shocks on bank profitability. The data is at the daily frequency for the period from 1999-01-05 to 2022-11-21. As features, we include the two-year yield (an excellent proxy of anticipated rates in the near-term and therefore a great measure of monetary policy shocks — indeed, it is almost as good as the Fed’s BRW shock series), and the spread between the yields on two-year and ten-year Treasuries. The first is a measure of the LEVEL of the yield curve; the second measures the SLOPE (these factors are important for pricing fixed-income assets). We detrend both our features by first-differencing. Adjusted closing prices for all stocks are obtained from NASDAQ and yields are obtained from FRED. We drop the intercept because we never find it to be significant (meaning that there’s no premium, positive or negative, associated with banking stocks relative to the market portfolio).
We first run a full sample regression. We find a market beta of 1.36, consistent with the picture of bank stocks as leveraged bets on the market portfolio. We also find significant and positive elasticities for both the level and the slope factors. We find a very similar pattern if we use the market-weighted portfolio of financials, instead of our concentrated bank portfolio. (If we use the 3-mo bill instead of the two-year as the level factor, it doesn’t work; likely bc markets almost always anticipate changes in the policy rates before they are announced. This is why the two-year is a better proxy of the Fed’s rate policy.)
The regression above conceals a great deal of temporal variation in the elasticity of bank returns to rate shocks. In order to understand this diachronic variation, we run separate regressions for each year. It turns out that the market beta of banks and financials is usually closer to unity. Indeed, year-to-date, the market beta of the bank portfolio is 0.98 and that for financials is exactly 1.00. Turns out the aggregate estimate of 1.36 is almost entirely driven by the exceptional crisis period 2007-2012; especially 2009, when all stocks revived under heroin injections from the Fed, and traders figured that something like the neoliberal financial system would survive Armageddon after all.
The next graph documents our main result. We find that bank stocks were neutral with respect to yield curve shocks until the financial crisis. Then there was a period, 2008-2015, in which they responded to near-term rate expectations embedded in the level factor, while being relatively unresponsive to the slope factor. The 2016-2021 period is a different regime. With the revival of the monetary cycle (recall that the era is kicked off by Yellen’s failed hiking cycle), banks and financials become very responsive to rate shocks. Finally, their elasticity towards rate shocks vanishes again in 2022.
The diachronic pattern documented above is an explanandum of great interest, especially to monetary policymakers. One theory (ht @AgCalvion) is that the banks’ funding strategies have changed materially. FedGuy suggests that the driving factor here is the superabundance of deposits.
The superabundance of retail deposits suggests that Fed hikes will have a very limited passthrough to the public. Banks typically pass on Fed hikes to the public in the form of higher deposit rates as they compete for cheap deposit funding. Higher deposit rates could in turn dampen consumer spending by raising the opportunity cost of cash. The pass-through of rates hikes to depositors was very limited in the last hiking cycle, and will likely be non-existent this cycle as the supply of deposits has since increased by several trillion.
Joseph Wang. FedGuy, November 1, 2021.
Although plausible in theory, it doesn’t quite explain the pattern that we have established. Bank deposits grew extremely rapidly between April 2020 and March 2021 from the unprecedented government largesse during the lockdowns. Yet, bank stocks responded strongly to rate shocks in both 2020 and 2021. It is only in 2022 that they become neutral with respect to innovations in the yield curve.
Moreover, deposit growth has been negative for months. Why should investors believe that deposits will remain a reliable and cheap source of funding for the banks? That they won’t be forced to cede the surplus to depositors in the form of high rates due to market competition? This is especially puzzling in light of the market-consistent expectation that deposits will continue shrinking or grow very slowly for as long as the Fed has its foot on the brake, and perhaps even after if the coming recession is attended by significant cash income reductions as seems likely.
So, we’re still waiting for an explanation of the puzzle of the present investor enthusiasm for bank stocks. It’s important to get to the bottom of this because it has very important implications for monetary policy. If this channel of policy transmission has indeed closed again, as our estimates suggest, then the Fed may have to work even harder to contain inflation.
Let me know if you have a theory.
Like a coiled spring ready to burst forward, financials/banks have been anxiously awaiting a rising rate environment for over a decade. Banks can now charge much higher rates on credit than they pay customers on deposits. Banks generate a high percentage of their earnings from interest rates, especially ones who do not benefit from asset management fees, trading revenue or investment banking.
ZIRP compressed spreads (the amount of interest charged minus the amount paid out) for a protracted time period. In a rising rate environment, banks are seeing their profitability improve.
Banks also collect interest on cash sitting in bank accounts, along with their customers. Investors stockpiling cash during market volatility will put money into bank deposit, money market and cash-equivalents. Financials that offer money market funds and other cash deposit products have had to waive fees on these products for a decade or more just to pay out “some” interest to their customers. Now, net interest revenue from the cash in bank and money market funds is soaring.
Prepayments on MBS have slowed tremendously, too, with the rise in interest rates. For banks that have large mortgage-backed portfolios, the pullback in prepayments dramatically lessens the compression on margins.
I don't buy the idea that YC shape has a large effect on NIM. Banks take very little duration risk. They swap LT fixed rate funding back to floating and don't lend at fixed rates. Fixed mortgages are securitized to get them off the banks' balance sheets. Duration risk as a mainstay of bank balance sheets died along with the S&Ls.