Shareholder Payouts, Underinvestment and the Productivity Slowdown
Why have firms been underinvesting since 1980?

The United States is in long-term strategic competition with China. The game is looking increasingly rigged towards the latter. None of the clever stratagems cooked up by Washington can move the needle. Ultimately, the power that sustains greater rates of productivity growth will prevail. Productivity is also the master key to the standard of living and the well-being of people. In the long-run almost nothing else matters quite as much. The bad news is that American productivity growth has slowed down dramatically since the neoliberal era began with the Volcker coup in 1979.
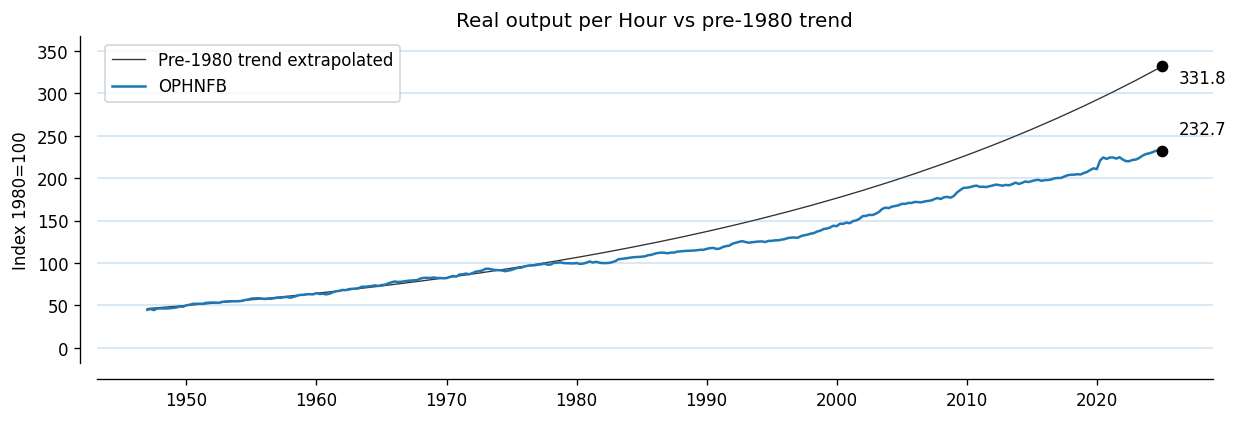
Had productivity growth been sustained at the pre-1980 trend, real output per hour of American workers would’ve been 40% higher, and therefore, so would per capita income. US GDP is roughly $28 trillion. Had productivity kept up, it would’ve been $40 trillion. That $12 trillion is more than the combined GDP of Germany, France and Britain!
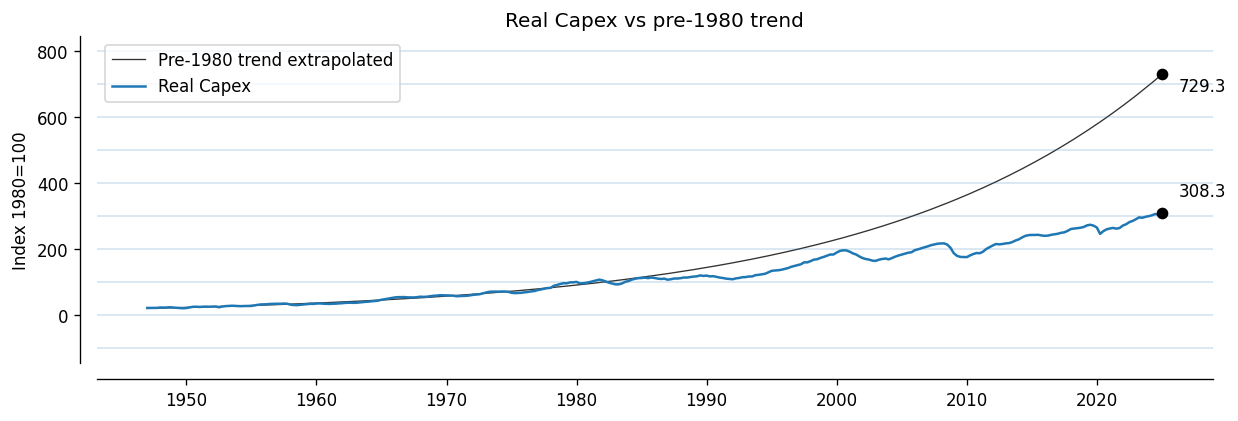
The proximate reason productivity growth has been slow since the Volcker coup is that firms have been investing much less. Had real nonfinancial fixed investment kept growing at the pre-1980 pace, it would’ve been 136% larger today.
Why, then, has there been a marked slowdown in capex? A very interesting paper by Gormsen and Huber, argues that firms’ internal hurdle rates of return are sticky and inelastic with respect to the external, financial market, cost of capital. So, despite the secular decline in the cost of capital since the 1980s, hurdle rates have stayed relatively high. Roughly speaking, hurdle rates are around 12%, even as the cost of capital has declined to 6-8%. So, there’s about a 5% wedge. They also show that this is largely due to oligopolistic firms maintaining high hurdle rates, even as firms more subject to product market competition have lowered their hurdle rates.

In this note, we document a corollary of this thesis. We argue that firms face a choice between capex and disgorging their surplus to investors. We show that firms that compensate investors more, tend to invest less. In this way, Wall St darlings have been harming both their own long-term competitiveness and that of the United States.
The standard model of capex is Tobin’s Q theory. Here’s ChatGPT’s blurb.
Tobin's Q theory of investment posits that the market value of a firm’s assets should be equal to the replacement cost of those assets. If the market value is higher (Q>1), it may indicate the company is overvalued and should invest in additional assets to increase profitability. Conversely, if the market value is lower (Q<1), the company may be undervalued and should reduce investments to improve returns. This theory suggests that firms should base their investment decisions on the relationship between the market value and replacement cost of their assets to maximize efficiency and profitability.
In my dataset of 13,153 firms as of 2025Q1, 37% have Q < 1, meaning that they’re underinvesting in their own future. Q is the ratio of the market value of the firm’s debt and equity to assets. We define capex as gross investment in fixed assets, adjusted downwards by the book value of any fixed assets the company disposed of during the period. We scale capex by firm assets to obtain comparable capex rates.
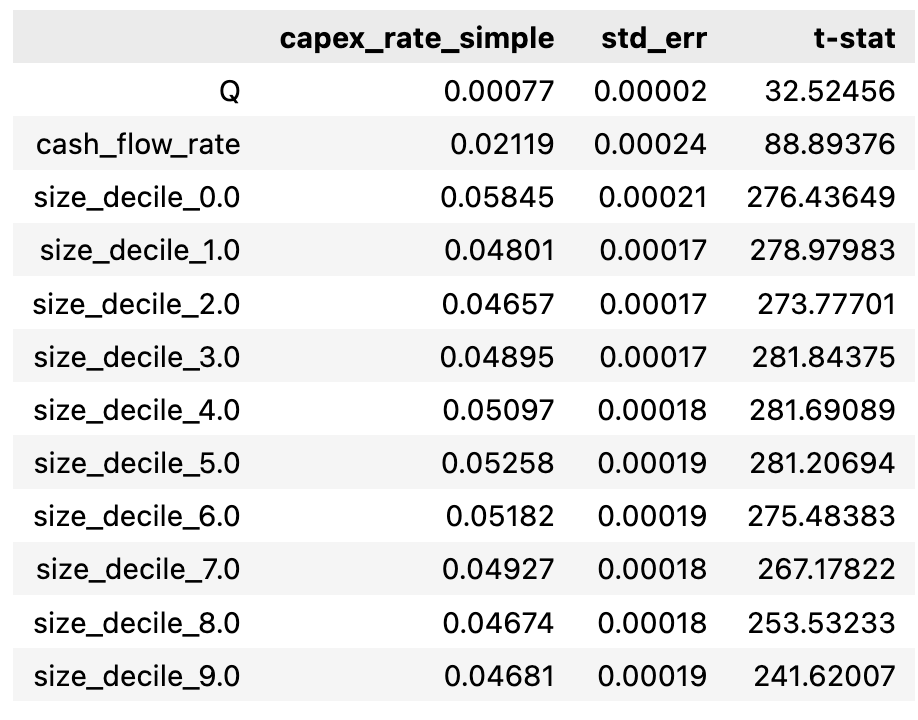
In order to understand underinvestment, in the first pass, we regress capex on Q controlling for cash flow and asset size deciles. The former control makes sense because we can hardly expect cash strapped firms to invest much. The latter control is important because smaller public firms tend to invest a lot more. We do indeed recover the expected pattern. We exclude financial sector firms. The next table displays the coefficient estimates for the first pass. We find economically reasonable coefficients.
We’re interested in understanding the residuals of the first pass regression. These are capex rates that are unexplained by Tobin’s Q, firm size, and cash flows. This will be our response in the second pass regression. Our feature of interest is the total payout ratio. Total payouts are defined as all cash returned to common shareholders obtained summing cash dividends paid and net cash spent on share repurchases (buybacks less issuances). The total payout ratio is the ratio of total payout to the sum of total payout and capex. The logic is that firms have to choose between returning money to investors and investing in productive assets. So, this ratio contains a signal of firms’ strategic decision to choose between compensating external investors and investing in their own future. We show that firms with higher payout ratios sport lower capex rates.
We exclude firm-quarters where either the capex ratio or the total payout ratio is negative. We admit both time fixed-effects and firm fixed-effects, which takes care of practically all confounders. We cluster errors by firm and quarter. Two way clustering of standard errors provides additional robustness to our result. The next table displays the result of the panel regression.
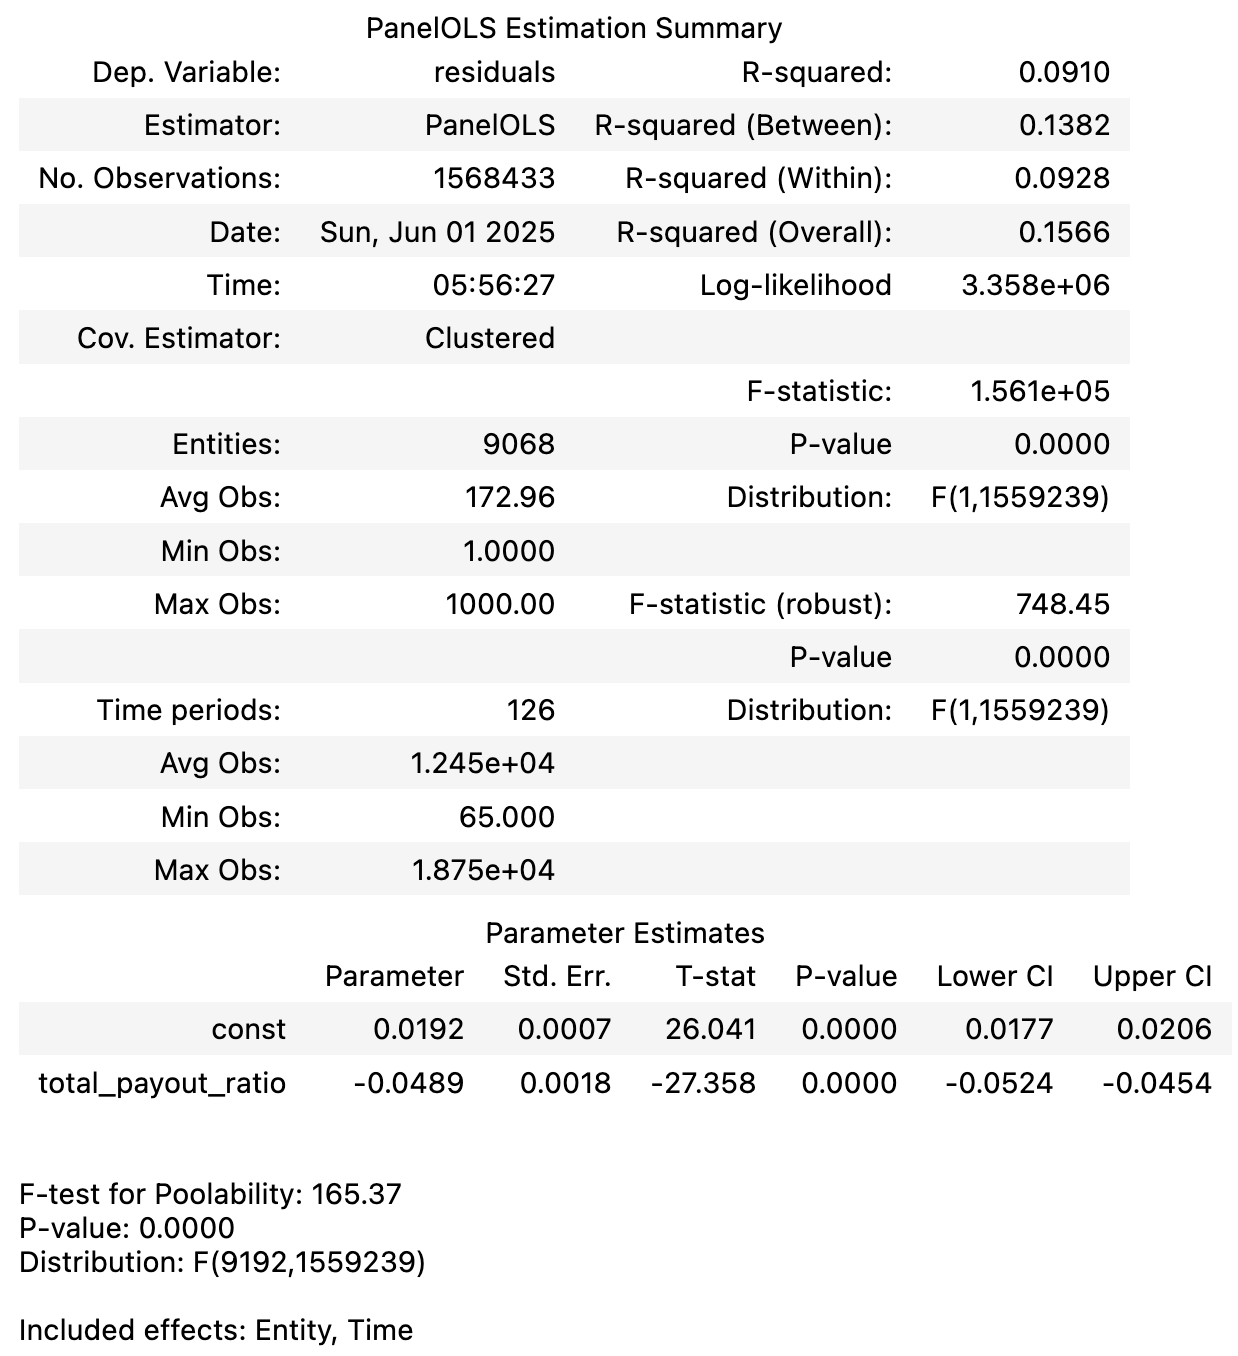
We find that both firm and time fixed effects are highly significant (P < 0.0001 for both F-tests). The within-R-squared of the model is 9.3%, which is very large indeed, suggesting that our simple model provides a good fit. The estimated slope coefficient is large and highly significant (b = -0.0489, P < 0.0001). The economic magnitude of the coefficient is very large. If a company increases its total payout ratio by 10 percentage points (eg, shifting its allocation from 30% payout-70% capex to 40% payout-60% capex) then our estimate suggests that its capex ratio is expected to be 0.489 percentage points lower than otherwise warranted. The total assets of non-financial firms are about $62 trillion. So, a 10 percentage point decline in our ratio implies an underinvestment of $300bn per annum!
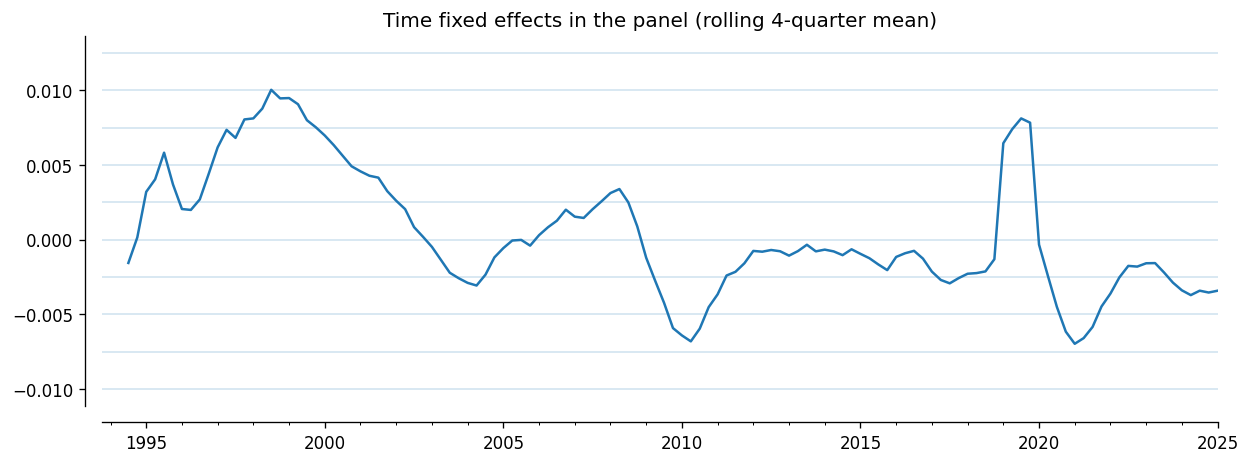
We can also estimate a magnitude of the decline in residual capex intensity from the time fixed-effects. We find a trend decline of 0.46 percentage points per annum. This is again a very large number: in twenty years, capex intensity halves at this rate. The fluctuations in the time fixed-effects are also informative. The first cycle corresponds to the late-1990s boom; the second to the mid-2000s boom, and the 2019 cycle to the Trump tax holiday for capex that kicked in with the Tax Cuts and Jobs Act.
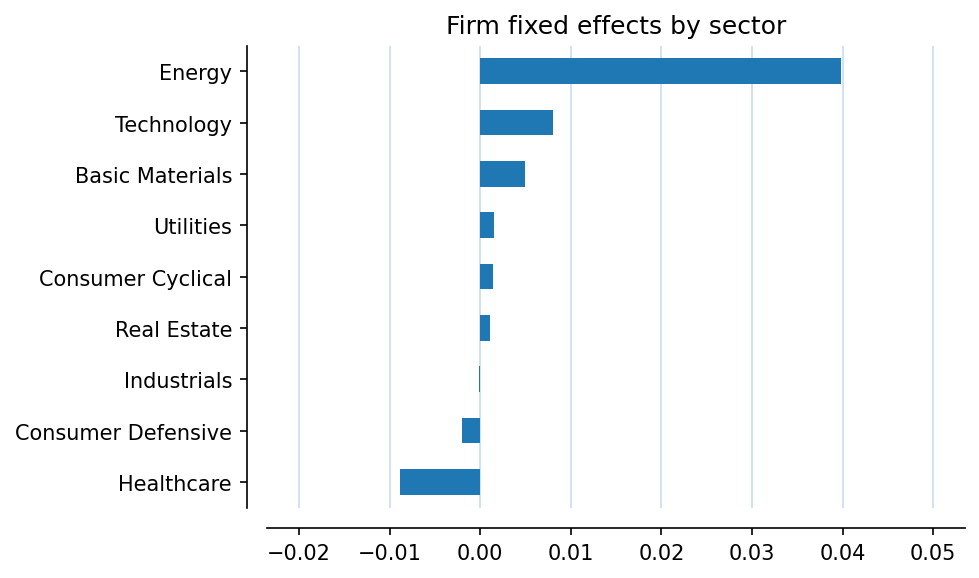
The next figure shows the average firm fixed effects by sector. Relatively speaking, energy firms have tended to invest more intensively than other sectors. This makes sense: this is the period of the fracking boom. Second but far behind is Technology. Healthcare is the laggard, as is appropriate for one of the most oligopolistic sectors. Most concerning are Industrials, the beating heart of American industrial capitalism. The average fixed effect for industrial firms is zero, meaning that the observations and estimates above apply also to industrial firms as well.
We have shown evidence that US firms that payout more to investors tend to underinvest. Gormsen and Huber (2025) argue that this is because of managerial discipline. But why are managers so disciplined? It’s because of the incentives they face: facing limited product market competition, managers of oligopolistic firms get bigger annual performance compensation from stock price appreciation than from investing in long-term value. It just makes more sense for them to return money to investors. Neither oligopolistic market structures nor short-term stock-based performance compensation are in the American national interest; above all, because they harms America’s long-term productivity growth.
There are three policy solutions to the grave problem posed by underinvestment, misaligned incentives and oligopolistic market structures.
First, laws and regulations should be designed to incentivize productivity-enhancing investment, rather than investor compensation. This could take the simple form of high taxes on stock performance-based manager compensation. Second, more robust policies to encourage product market competition, including antitrust enforcement and incentives for market entry, would go a long way to lean against the secular trend towards oligopolization. Third and finally, we should have much stronger incentives for capex and R&D. We know that that capex and R&D respond rapidly to policies like tax credits.1 Indeed, we have seen above that the Trump incentive led to an immediate spike in capex intensity. But one-off tax holidays create one-off incentives. We need a more long-term strategy to incentive capex and innovation. A policy mix that strongly incentivizes capex and R&D should yield large productivity gains.
Just because a variable is slow-moving does not mean it is not the controlling variable. Almost everything is on the line on this question. This should be top priority.
Akcigit et al. (2021) show that R&D tax credits introduced by the Reagan administration is 1981 were extremely effective in accelerating the rate of innovation and therefore productivity growth. The market failure addressed by these policies is due to the fact that firms underinvest in R&D because they not internalize the gains made in the future by those who build on their work. Working in an open economy framework, they also show that the optimal unilateral tariff rate is zero. See this viral twitter thread where I highlight some of their results.